From regions to states to counties, all with a click.
Maps are great for showing where something is happening. But what if your audience wants to explore further into that location?
In this tutorial, we'll build an interactive Tableau map that lets users move from a regional overview to individual states and counties, then navigate back without losing their place.
We'll combine set actions, parameter actions, and a few clever calculations to create a seamless experience.
What you'll learn
The result: A map that encourages exploration without making users work harder to find answers.

We'll use Tableau's sample Obesity data from the Regional workbook to build a map that moves between regions, states, and counties.
Don't have a Region field? No problem. You can create one from your state data.
A little flexibility: If your dataset doesn't include counties, you can adapt the technique to another geographic level, such as cities or postal codes.
We'll use set actions to expand selected regions, parameter actions to switch between map views, and a few calculations to keep everything connected.
Ready? Let's build it.
Let's start with the big picture: a map of the United States grouped into regions.
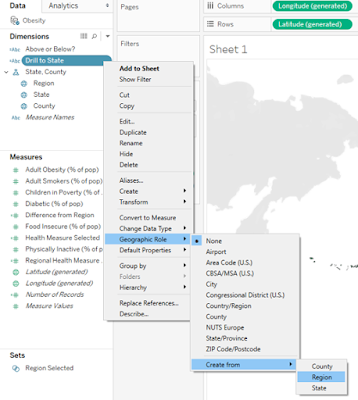
In Tableau's Data pane:
This tells Tableau how to draw your custom regions using their underlying states.
Tip: If you hold the right mouse button instead of the left mouse button when you select and drop the measure, a window will pop up that allows you to choose the aggregation of the measure.
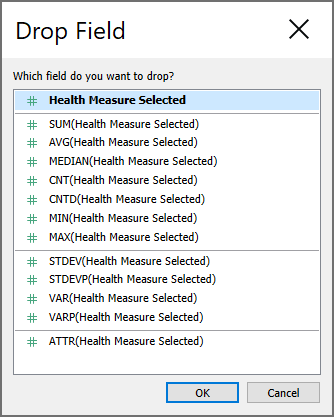
For this example, we're using Health Measure Selected, a calculation that allows users to switch between health statistics.
You should now see a map of the United States with regions colored according to your selected measure.
That's our starting point! Next, we'll make those regions interactive.
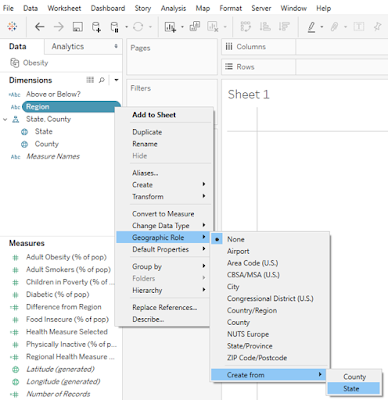
Right now, our map displays regions. Let's give users a way to explore the states inside them.
We'll use a set to track which region is selected and a calculation to reveal its states.
In Tableau's Data pane:
Region Selected.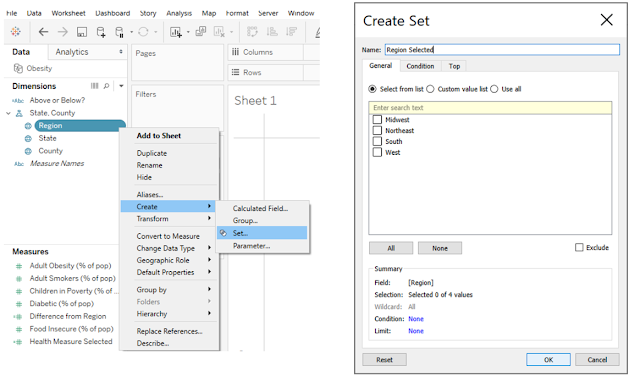
This set will identify which region we want to expand.
Create a calculated field named Drill to State and enter:
IF [Region Selected] THEN [State] END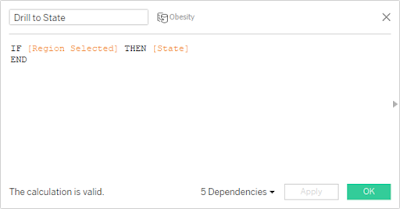
When a region belongs to the selected set, the calculation returns its states. Otherwise, it returns Null.
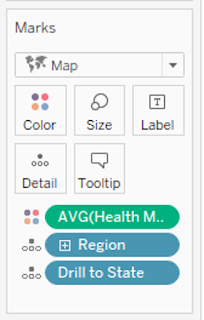
Now our map has the fields it needs to display individual states within a selected region.
What's next? We'll prepare the county-level map, then connect the views with dashboard actions so users can actually click to drill down.
We've made it possible to expand regions into states. Now let's go one level deeper.
We'll create a second map for counties, then use a parameter to control which map appears.
County-level.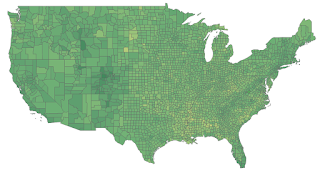
In Tableau's Data pane:
State (For County).US Map to the list of states.the United States.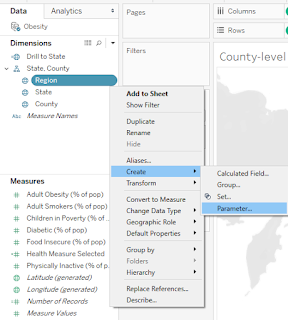
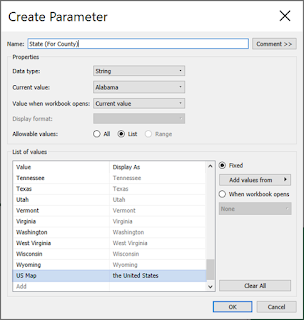
This extra value gives us a way to return to the national map.
Create a calculated field named County Map Pop-Up Logic:
IF [State (For County)] = [State]
THEN "Show County-Level Map"
ELSEIF [State (For County)] = "US Map"
THEN "Show Region/State Map"END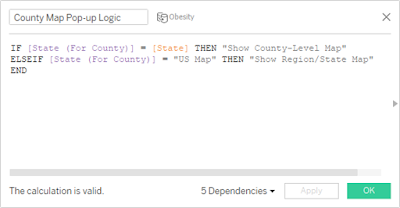
This calculation determines which map should be visible based on the parameter's selected value.
On the County-level worksheet:
State (For County) parameter control.Show County-Level Map.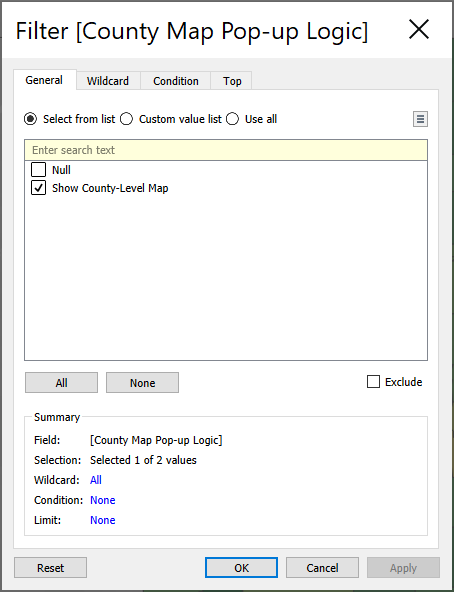
Return to your regional map worksheet:
the United States.Show Region/State Map.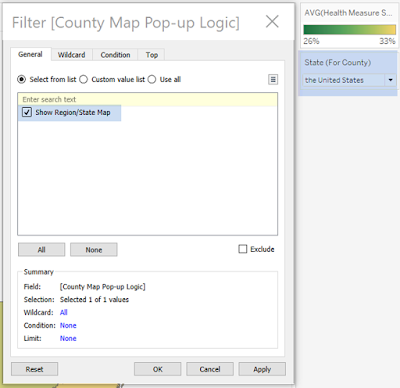
We now have two maps ready to respond to the same parameter.
Coming up: We'll arrange them on a dashboard and connect everything with actions so users can navigate by clicking the map itself.
Our maps are ready. Now let's make them look polished and give them a shared home.
On your regional map worksheet:
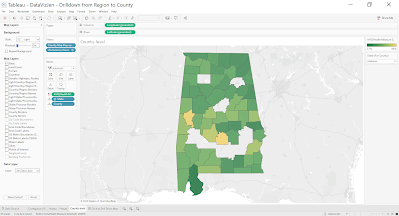
Repeat for the county map.
Time-saving tip: You can right-click a formatted worksheet tab, select Copy Formatting, then right-click another worksheet tab and select Paste Formatting.
For the county map, select a state in the State (For County) parameter first so the map is visible while you format it.
County-level worksheet to the same container.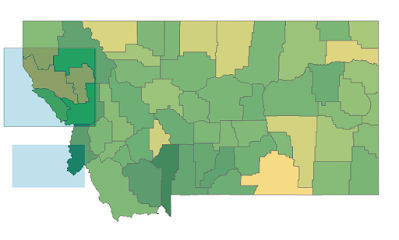
Keeping these worksheets together prepares them to switch based on the State (For County) parameter.
If you're displaying Alaska and Hawaii separately, you can position their worksheets alongside the contiguous US map.
In the original design, a blank area prevents those floating worksheets from blocking tooltips when the county map appears.
Alternatively, consider a tiled layout with containers that collapse when they're not needed.
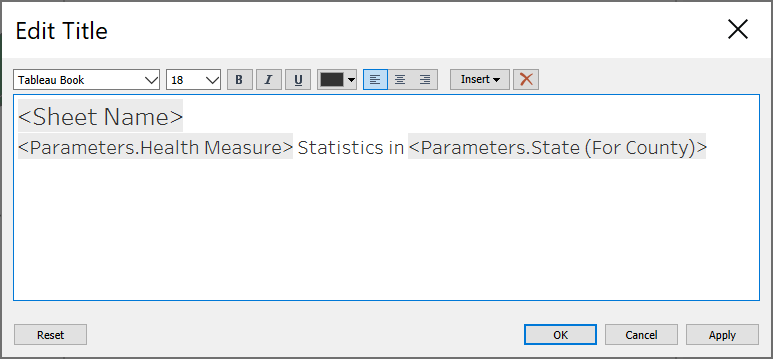
Give the dashboard a clear title and use the selected state parameter in the subtitle so readers always know which geographic level they're exploring.
Our maps are now assembled!
Coming up: We'll fix the color legend so it displays meaningful values as users switch between the regional and county views.
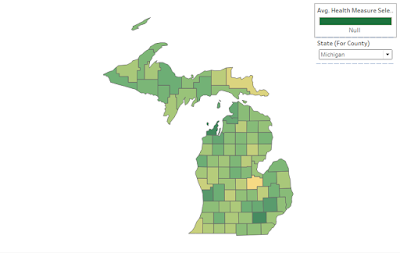
When we switch between the regional and county maps, Tableau may display Null in the color legend.
Not exactly the polished experience we're going for!
We'll create a separate worksheet that controls the legend based on the selected geographic level.
Create a calculated field named Color Legend Logic:
IF [State (For County)] = [State] THEN [County]
ELSEIF [State (For County)] = "US Map" THEN [State]
END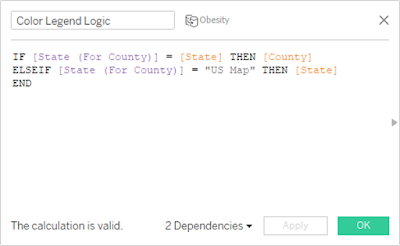
This calculation returns the appropriate geographic field based on the current map view.
Color Legend.X: -1, Y: -1.1 × 1 pixels.The worksheet stays out of sight while its legend remains visible.
The result: A cleaner dashboard with a color legend that responds to the geographic level being explored.
Next, we'll connect our maps with dashboard actions and make the drilldown interactive!
We've built our maps and arranged them on a dashboard. Now let's connect everything so users can explore by clicking.
We'll use two Tableau dashboard actions to make the drilldown work.
On your dashboard:
Expand Region.Alaska, Contiguous US, and Hawaii.Select.Region Selected set as the target.Remove all values from set.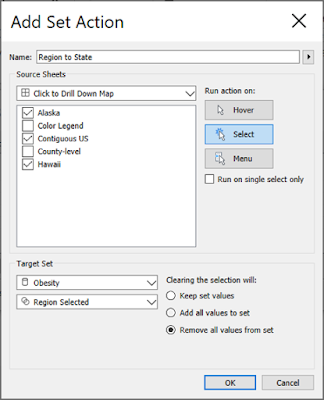
Click OK to save.
Now selecting a region updates the set we created in Step 2, allowing its states to appear.
Still in Dashboard → Actions:
Drill to County.Select.State (For County) as the target parameter.Drill to State.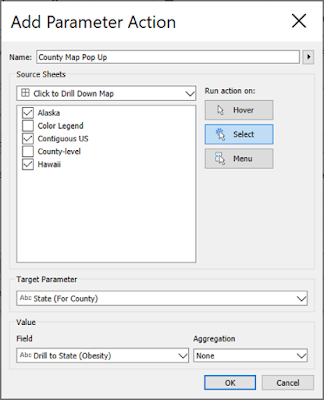
Click OK.
When a user selects a state, the parameter updates to that state. Our map-switching logic then displays its counties.
Return to your dashboard and try the interactions:
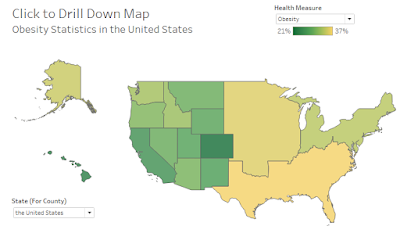
It works! We've connected the geographic levels using Tableau's interactive actions.
But there's one thing missing: an easy way back.
Coming up: We'll create breadcrumbs so users can return to their expanded region or reset the map entirely.
Our map can drill from regions to states to counties. But how do users get back?
We'll create two small worksheets that act as navigation controls:
First, expand a region on your dashboard. If you're viewing counties, change the State (For County) parameter back to US Map.
Create a new worksheet:
Out members of the set so this control only appears after a region is selected.Create a calculated field named US Map:
"US Map"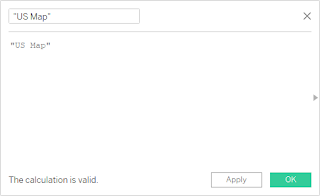
Double Click Here to Reset Map View.Reset View.In the original design, this reset control uses two clicks. We'll preserve that behavior for now and test whether we can simplify it.
We'll use a few calculations to display navigation text only when someone is viewing counties.
Create Showing Counties:
[State (For County)] <> "US Map"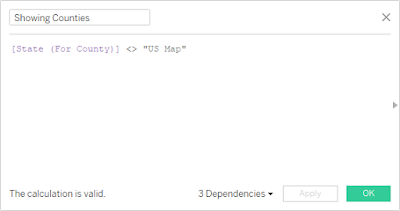
Create Return to:
IIF([Showing Counties], "Return to ", "")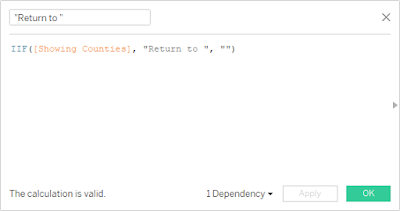
Create State Selected:
IIF([Showing Counties]," > " + [State (For County)], "")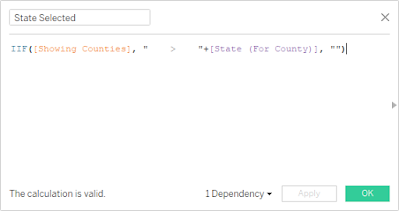
Now create another worksheet:
True.Return to Region Expanded.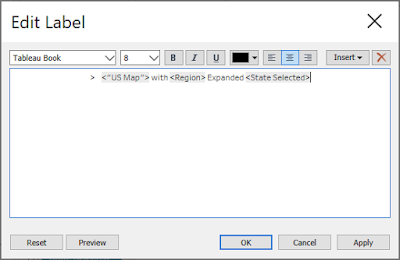
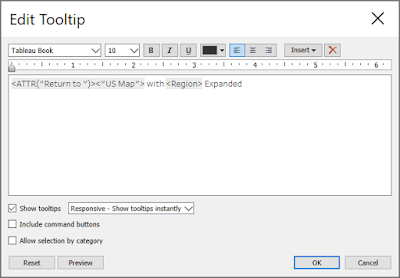
This gives users a visual reminder of where they are and a way to return to the expanded region.
Place both worksheets above the maps.
You can use floating elements for precise positioning or tiled containers for a more responsive layout.
Set each breadcrumb worksheet to Entire View and keep its label and tooltip formatting consistent.
Important: Check your existing dashboard actions. Tableau may automatically include newly added worksheets as action sources. Remove the breadcrumbs from any actions they shouldn't trigger.
Open Dashboard → Actions and add three actions:
Return to Region Expanded
Return to Region ExpandedState (For County)US Map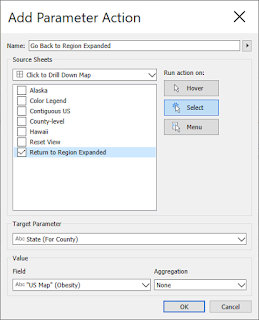
Return to US Map
Reset ViewState (For County)US Map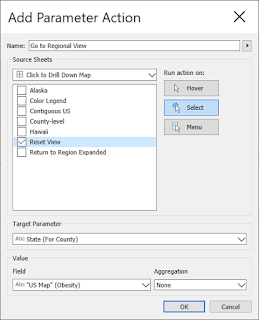
Clear the selected region
Reset ViewRegion Selected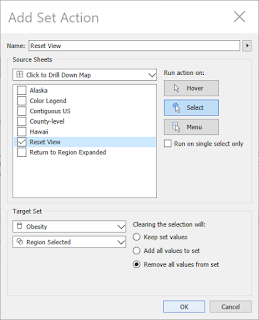
Together, these actions let users move back from counties to states, then reset the entire map.
Try the complete journey:
Success! Our map now supports both drilldown and drillup navigation.
Coming up: We'll add meaningful comparisons so users can understand how each region, state, and county performs against its parent geographic level.
Exploring a map is useful. Understanding how one location compares to another makes it even more powerful.
We'll use Tableau's Level of Detail (LOD) expressions to calculate averages at different geographic levels.
Our comparisons will follow the drilldown:
Create a calculated field named National Health Measure:
{ AVG([Health Measure Selected]) }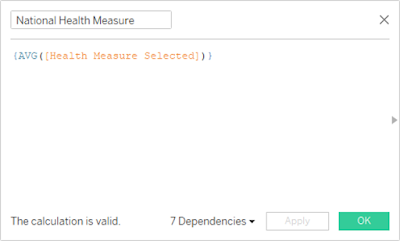
This gives us an overall benchmark for the country.
Create Regional Health Measure:
{ FIXED [Region] : AVG([Health Measure Selected]) }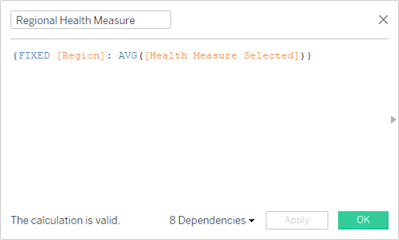
Each region now has its own benchmark.
Create State Health Measure:
{ FIXED [State] : AVG([Health Measure Selected]) }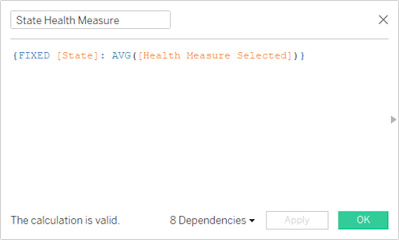
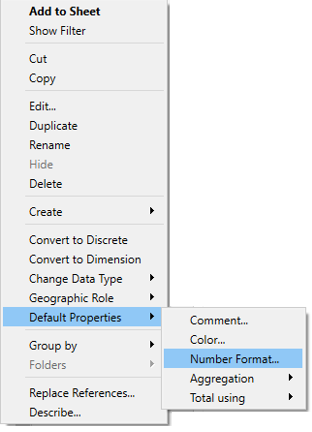
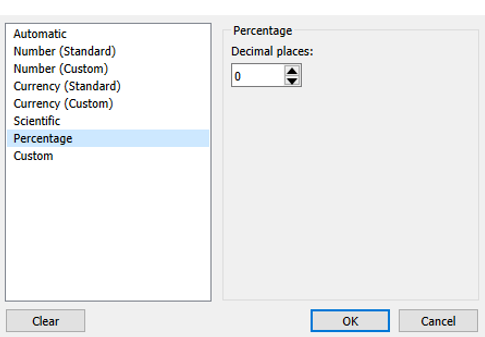
Format the result as a percentage if you're working with percentage-based health statistics.
Create County Health Measure:
{ FIXED [County] : AVG([Health Measure Selected]) }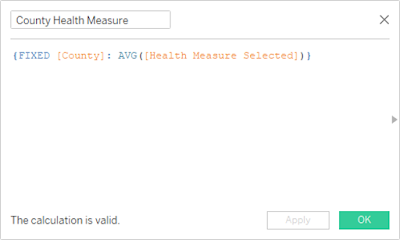
This matches the original tutorial, which displays counties within one selected state at a time.
A note about your data: County names can repeat across states. For a dataset covering multiple states, consider including both State and County in the FIXED expression.
We've established our geographic benchmarks. Next, we'll calculate the differences and use them to tell a more meaningful story in our tooltips.
When users expand a region, we want to compare its states with the regional average. Otherwise, we'll compare regions with the national average.
Create Regional or National Health Measure:
IIF([Region Selected], [Regional Health Measure], [National Health Measure])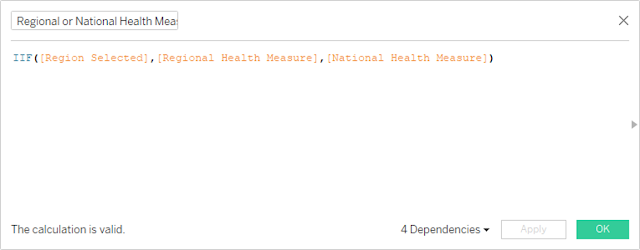
Create Regional Difference from National:
ROUND([Regional Health Measure], 2) - ROUND([National Health Measure], 2)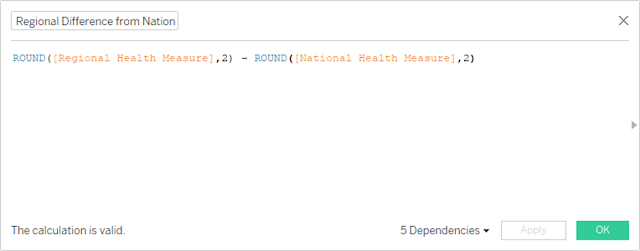
Create State Difference from Regional:
ROUND([State Health Measure], 2) - ROUND([Regional Health Measure], 2)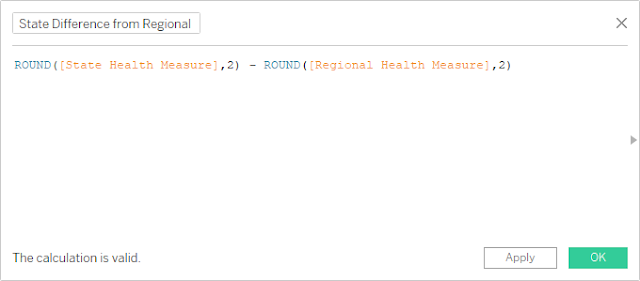
Create County Difference from State:
ROUND([County Health Measure], 2) - ROUND([State Health Measure], 2)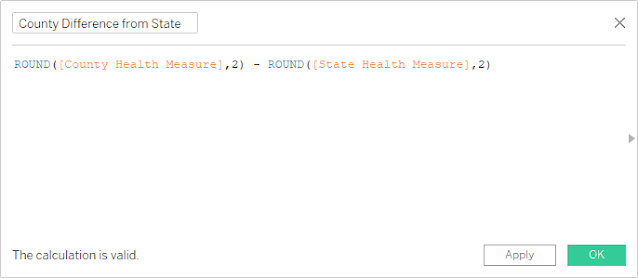
These calculations show how far each geographic level differs from its parent.
Create Regional or National Health Measure Difference:
IIF([Region Selected], [State Difference from Regional], [Regional Difference from National])
Now the comparison changes automatically as users expand regions.
Want to make those differences easier to scan?
In Tableau, right-click a difference calculation and select Default Properties → Number Format → Custom.
For the percentage-based health measures in this example, use:
0% ▲;0% ▼;Same as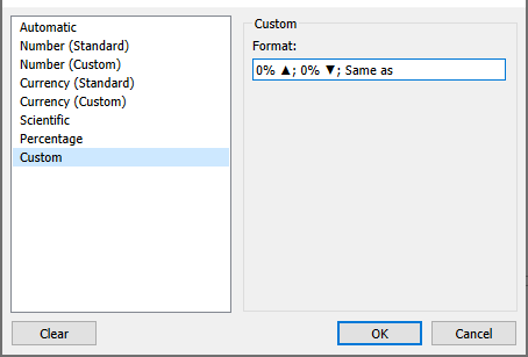
The three sections control how positive, negative, and zero values appear.
A formatting tip: The arrows are just characters in a custom number format. You can replace them with other symbols or use a simpler positive/negative display.
Create a calculated field named "regional" or "national":
IIF([Region Selected], "regional", "national")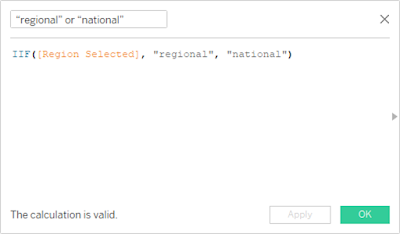
This gives our tooltips the correct comparison language automatically.
We've now built the calculations needed to compare regions, states, and counties with meaningful benchmarks.
Coming up: We'll turn these numbers into clear, interactive tooltips that guide users through the map.
Our map is interactive, our comparisons are calculated, and our navigation is ready. Let's bring everything together with tooltips that do more than display numbers.
We'll add three things:
Create a calculated field named Click to view:
IF [Region Selected] = TRUE THEN "Click to view Counties in " + [State]
ELSE "Click to view States in the " + [Region]
END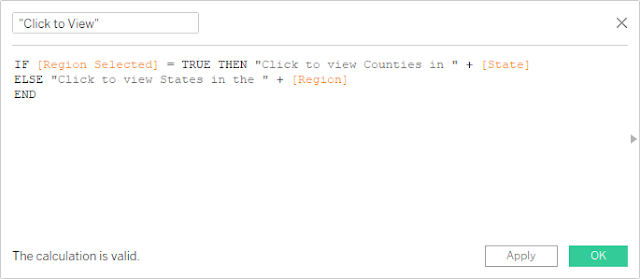
This message changes depending on whether the user is viewing regions or expanded states.
On each regional worksheet, including the contiguous US, Alaska, and Hawaii, add these fields to Tooltip on the Marks card:
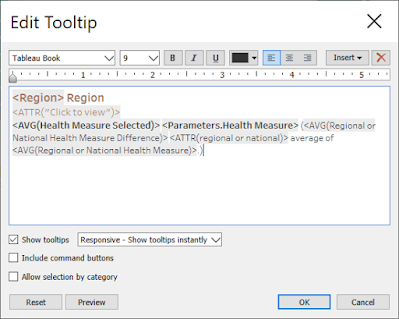
Then open Edit Tooltip and arrange the fields to show:
Region or State Name
Click to view States in the Region (or Counties in the State)
Selected Health Measure: Current value
Comparison: Difference from the regional or national average
Use Tableau's Insert menu to add the actual field values. This ensures the tooltips respond dynamically to the selected geography.
<Region> Region

<ATTR("Click to view")>

<AVG(Health Measure Selected)> <Parameters.Health Measure> (<AVG(Regional or National Health Measure Difference)> <ATTR("regional" or "national")> average of <AVG(Regional or National Health Measure)>.)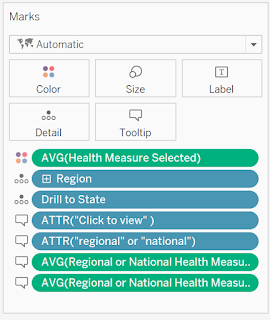
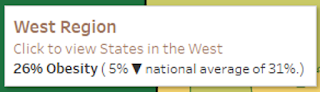
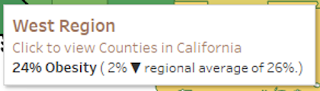
Tip: Tooltip fields can sometimes be finicky. If you are swapping out fields from the Marks box and the tooltips are not properly displaying, try opening and closing the tooltip or re-insert them from the Insert dropdown.
On the County-level worksheet, add these fields to Tooltip:
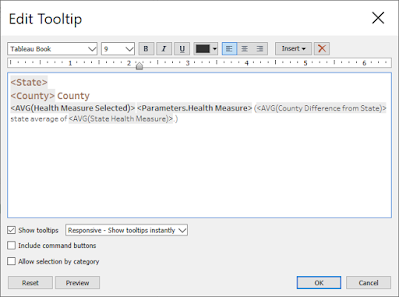
Format the tooltip to display:
State Name
County Name
Selected Health Measure: Current county value
Comparison: Difference from the state average
Include the state average so users can see both the benchmark and the difference.
<State>
<County> County

<AVG(Health Measure Selected)> <Parameters.Health Measure> (<AVG(County Difference from State)> state average of <AVG(State Health Measure)>.)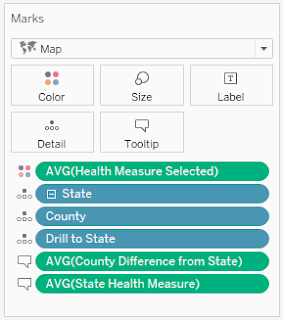
A few finishing touches make a big difference:
Before sharing your dashboard, follow the full journey:
And there you have it!
You've created an interactive Tableau map that encourages exploration, provides meaningful geographic comparisons, and gives users a clear path through the data.
Happy vizzing! 💗



Have a question or just want to say hi?
I'd love to hear from you.