
Your AI guide to DataVizJen. 💗
Need a human? Message Jennifer here 💌
Step-by-step guides for analytics, AI, visualization, and whatever else I’m currently figuring out.
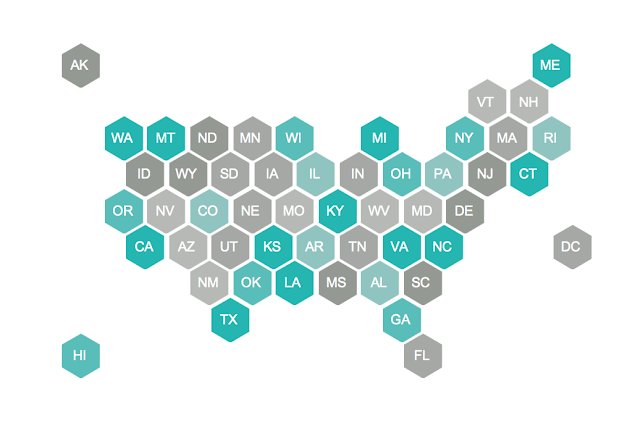
Explore five ways to map the United States in Tableau, including techniques for handling Alaska and Hawaii in dashboards.
Create a universal Apply button in Tableau using set actions and parameter actions to better control filtering across dashboards.
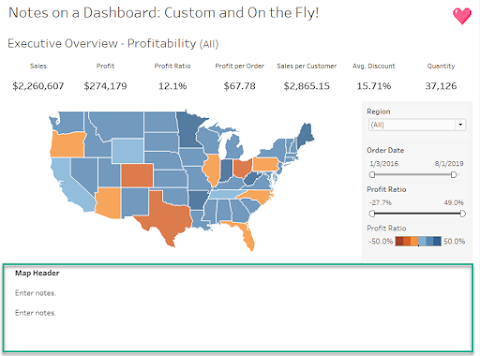
Let dashboard users add and update notes using Tableau parameters, calculated fields, and a show/hide container.
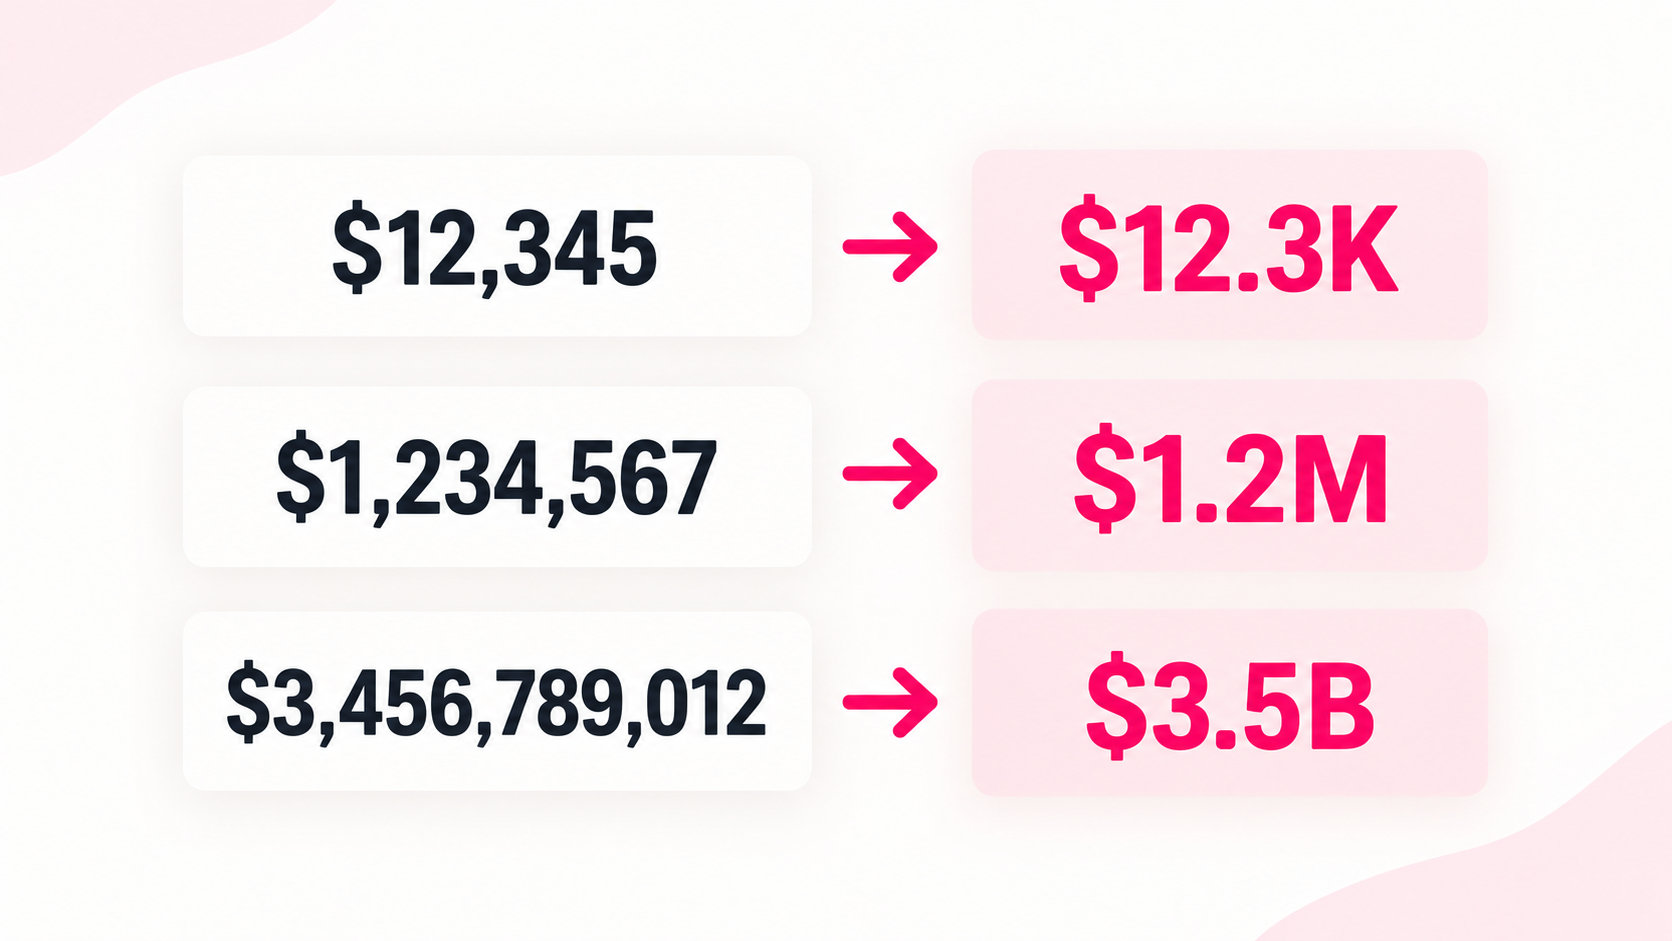
Create dynamic K, M, and B labels for continuous Tableau axes using table calculations and custom dashboard layouts.
Dynamic units make large metrics easy to read by automatically changing values to thousands (K), millions (M), or billions (B).
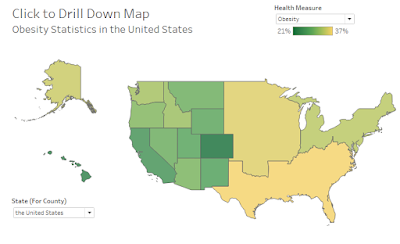
Build an interactive Tableau map to explore regions, states, and counties with drilldown actions, breadcrumbs, and dynamic tooltips.
Have a question or just want to say hi?I'd love to hear from you.