Ever wished Tableau could automatically display K, M, or B on a continuous axis?
Dynamic units are straightforward for text labels, but continuous axes are another story.
The workaround? Create our own axis labels using table calculations and separate worksheets.
In this tutorial, we'll:
Before you begin: Complete Dynamic Units of Measure in Tableau first.
Important: This technique requires removing zero from the original axis. Consider whether a zero baseline is essential for accurate interpretation before using this workaround.
Read a fun article on including/not including zero on a y-axis by Justin Fox on his blog byjustinfox.com.

Explore the finished workbook: Dynamic Units of Measure on Axes on Tableau Public
Tableau automatically determines a continuous axis range using its minimum and maximum values.
To create our own dynamic axis, we'll calculate five positions:
We'll use WINDOW_MIN() and WINDOW_MAX() to calculate the endpoints, then derive the three positions between them.
Important: The midpoint of an axis range isn't necessarily the average or median of your data.
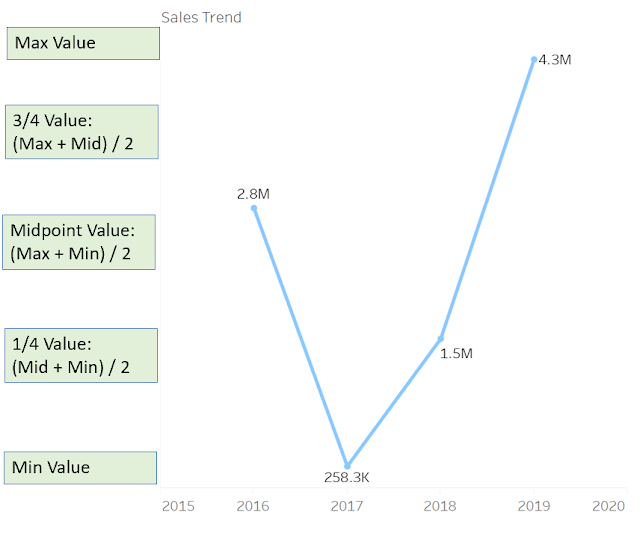
Because table calculations need access to the underlying data, we'll duplicate the original chart worksheet for each axis label.
Using separate worksheets gives us precise control over the vertical spacing of our custom axis.
Take a look at the original Sales trend chart. The values range from approximately 258K to more than 4M, but the continuous axis displays its labels in millions.
That's what we're going to improve.
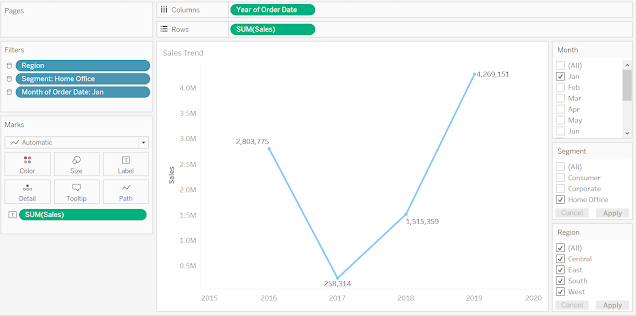
Duplicate the original chart worksheet and create a calculated field named Sales Axis Max Value and Unit.
Use WINDOW_MAX(SUM([Sales])) to calculate the maximum value, then apply the dynamic K, M, and B formatting technique from the previous tutorial.
You can optionally append -- to the formatted value to simulate an axis tick mark.
The original calculation is shown below.
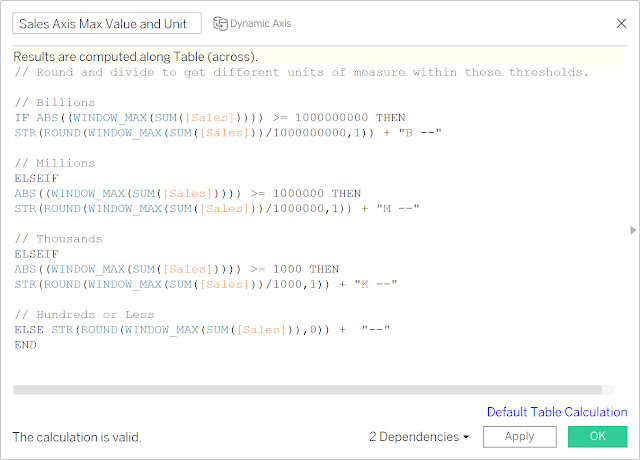
IF ABS(WINDOW_MAX(SUM([Sales]))) >= 1000000000 THEN
    STR(ROUND(WINDOW_MAX(SUM([Sales])) / 1000000000, 1)) + "B"
ELSEIF ABS(WINDOW_MAX(SUM([Sales]))) >= 1000000 THEN
    STR(ROUND(WINDOW_MAX(SUM([Sales])) / 1000000, 1)) + "M"
ELSEIF ABS(WINDOW_MAX(SUM([Sales]))) >= 1000 THEN
    STR(ROUND(WINDOW_MAX(SUM([Sales])) / 1000, 1)) + "K"
ELSE
    STR(ROUND(WINDOW_MAX(SUM([Sales])), 0))
END + " --"
Place the calculated field on Rows, then select Compute Using → Table (Across).
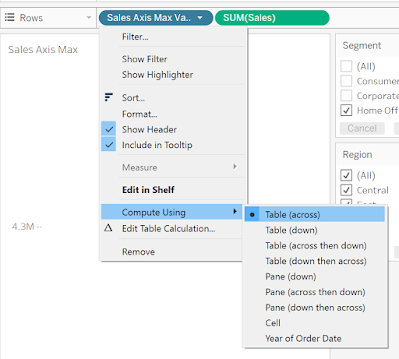
Repeat this process for the remaining four axis positions: minimum, midpoint, 25%, and 75%.
Create a separate worksheet for each label. You can also explore the completed Tableau workbook linked above to inspect the original calculations.
Place your original chart on a dashboard, then add a Vertical layout container to the left of the chart.
Drag your five axis-label worksheets into the container in this order:
- Blank spacer (top padding)
1. Maximum
2. 75%
3. Midpoint
4. 25%
5. Minimum
- Blank spacer (bottom padding, if needed)
Set the Maximum label's vertical alignment to Top and the Minimum label's alignment to Bottom.
Adjust the worksheet heights and container spacing until the labels align with the chart's axis.
The original example below shows how the padding helps position the labels.
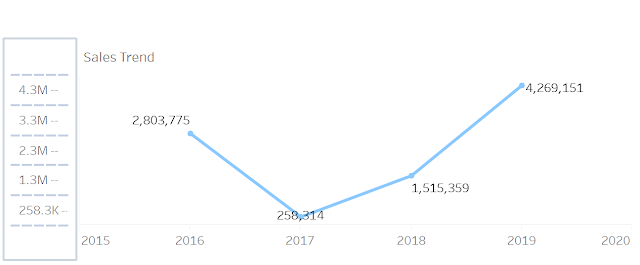
Finally, hide the chart's original axis header so only your custom labels remain visible.
For a cleaner-looking axis, you can round the calculated values to larger increments using Tableau's ROUND() function.
The second argument controls the rounding position. Negative values round to tens, hundreds, thousands, and beyond.
For example:
ROUND([Value], -3) rounds to the nearest thousand.ROUND([Value], -6) rounds to the nearest million.ROUND([Value], -8) rounds to the nearest hundred million.In the original calculation, the rounding precision changes depending on the unit. For example, billions are rounded using -8, while millions use -6.
Choose the precision that works best for your chart. If the values are too close together, aggressive rounding can produce duplicate axis labels.
You can also offer users a parameter to switch between rounded and unrounded labels.
Here's the original rounded maximum-value calculation.
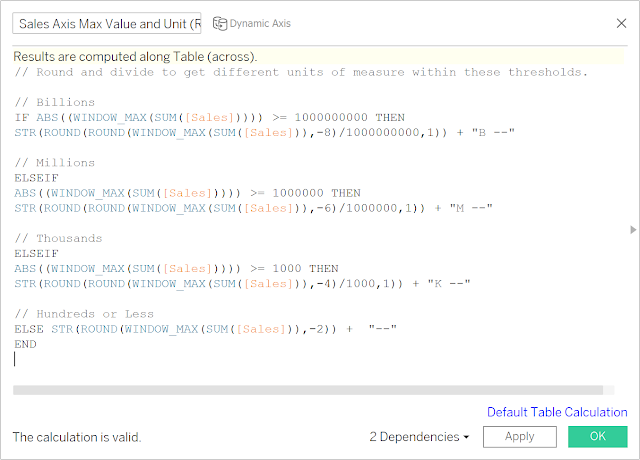
// Round and divide to get different units of measure within these thresholds.

// Billions
IF ABS((WINDOW_MAX(SUM([Sales])))) >= 1000000000 THEN
    STR(ROUND(ROUND(WINDOW_MAX(SUM([Sales])),-8)/1000000000,1)) + "B --"

// Millions
ELSEIF ABS((WINDOW_MAX(SUM([Sales])))) >= 1000000 THEN
    STR(ROUND(ROUND(WINDOW_MAX(SUM([Sales])),-6)/1000000,1)) + "M --"

// Thousands
ELSEIF ABS((WINDOW_MAX(SUM([Sales])))) >= 1000 THEN
    STR(ROUND(ROUND(WINDOW_MAX(SUM([Sales])),-4)/1000,1)) + "K --"

// Hundreds or Less
ELSE
    STR(ROUND(WINDOW_MAX(SUM([Sales])),-2)) + " --"
END
And voilà! We now have dynamic units of measure on our axis.
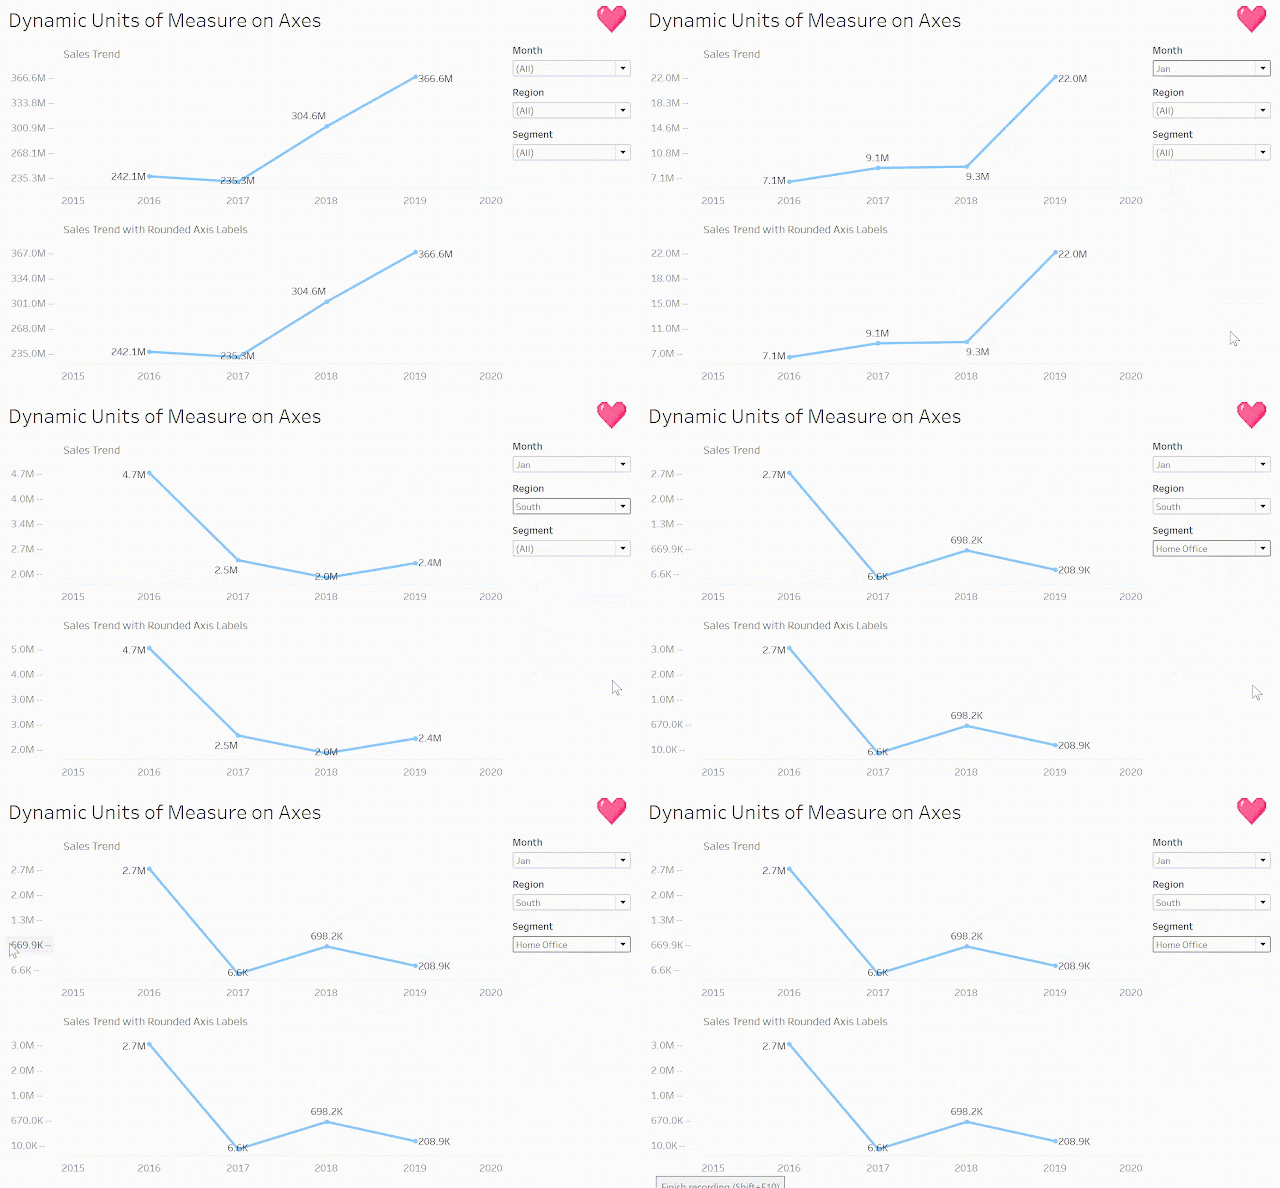
Experiment with the finished workbook to see how the axis labels respond as the data changes.
Happy vizzing! 💗



Have a question or just want to say hi?
I'd love to hear from you.