Which is easier to read?
$1,234,567,890.00 or $1.2B?
When someone is scanning a dashboard, they shouldn't have to count commas to understand a number.
Dynamic units make large numbers easier to read by automatically displaying values in thousands (K), millions (M), or billions (B), without changing the underlying data.
In this tutorial, we'll explore four ways to use dynamic units in Tableau:
And we'll address one important detail that's easy to overlook: negative numbers.

Let's get into it!
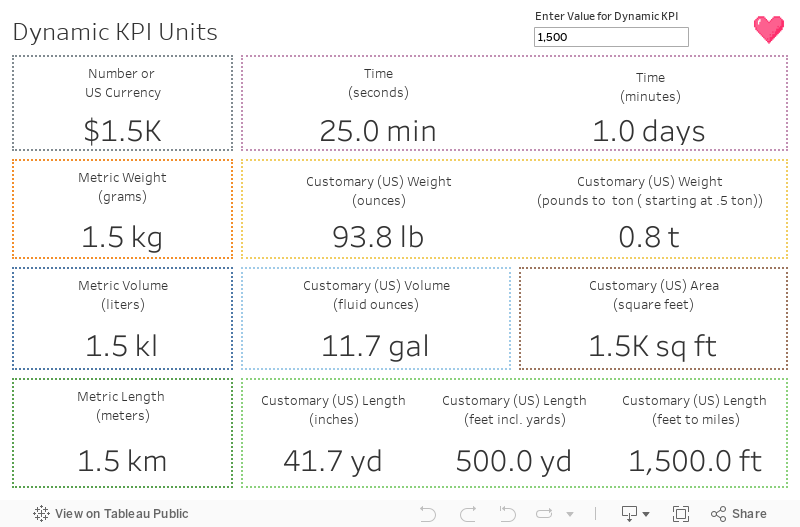
Dynamic formatting is a popular Tableau trick, but there's one important detail that's often overlooked: negative values.
Many examples use logic like this:
IF SUM([Sales]) >= 1000000 THEN "M" END
That works beautifully for positive values. But what happens when Sales is -1,000,000?
It returns a null value because -1,000,000 isn't greater than or equal to 1,000,000.
The solution? Use ABS() to evaluate the absolute value.
IF ABS(SUM([Sales])) >= 1000000 THEN "M" END
Now the calculation recognizes values of either sign. The original value can remain negative while the formatting logic determines the appropriate unit.
Personally, I prefer keeping measures numeric rather than converting them into strings whenever possible.
For KPI labels, we can create separate calculations for each magnitude:
Don't forget to assign the appropriate custom number format to each field!
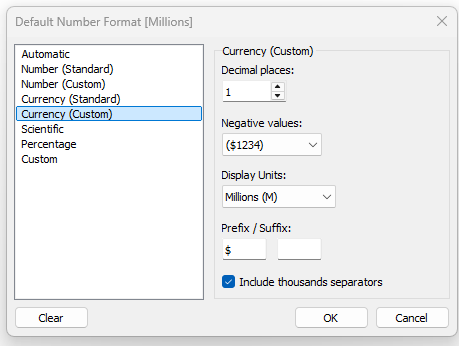
Here are the calculations for the numbers:
Calculated field: Hundreds or Less
IF ABS(SUM(Sales)) < 1000 THEN SUM([Sales]) ENDCalculated field: Thousands
IF ABS(SUM([Sales])) < 1000000 AND ABS(SUM([Sales])) >= 1000 THEN SUM([Sales]) ENDCalculated field: Millions
IF ABS(SUM([Sales])) >= 1000000 AND ABS(SUM([Sales])) < 1000000000 THEN SUM([Sales]) ENDCalculated field: Billions
IF ABS(SUM([Sales])) >= 1000000000 THEN SUM([Sales])ENDNotice that we're returning the original numeric value, not a string.
Finally, place all four calculated fields on the same line in Text on the Marks card.
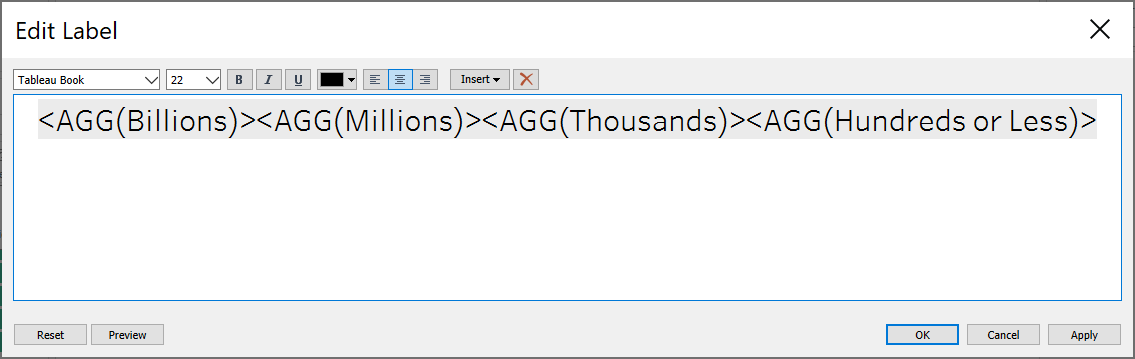
Because only one magnitude calculation returns a value at a time, the label displays the appropriate formatted number.
Why use this approach?
It keeps the calculations numeric and avoids unnecessary string conversions. The tradeoff is that we need multiple calculated fields to handle the different units.
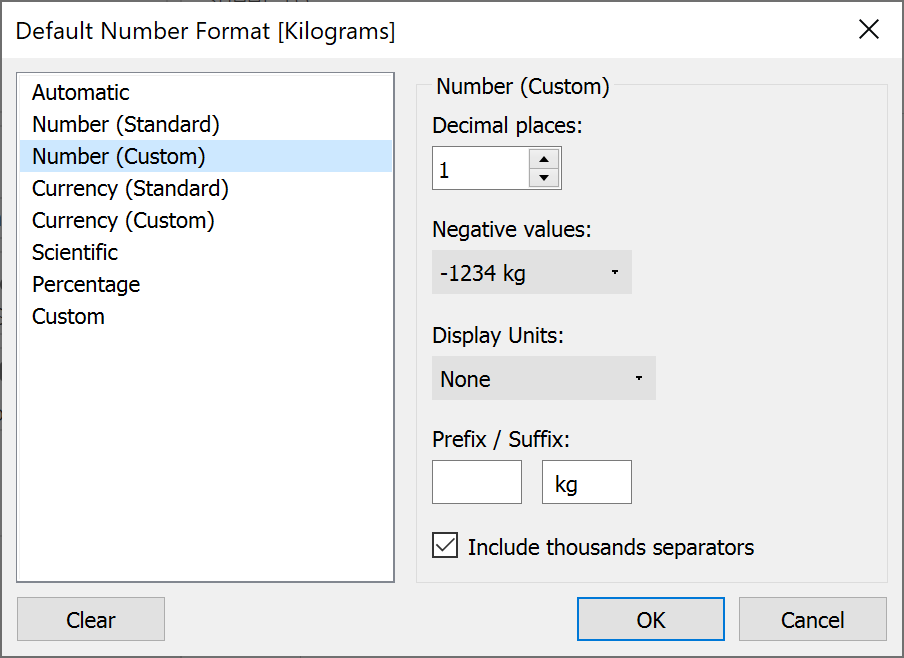
Tip: For units Tableau doesn't offer automatically, such as kilograms (kg), you can add the unit through the Suffix option in Custom Number Format.
This same approach can be adapted for currency, time, weight, volume, area, and length.
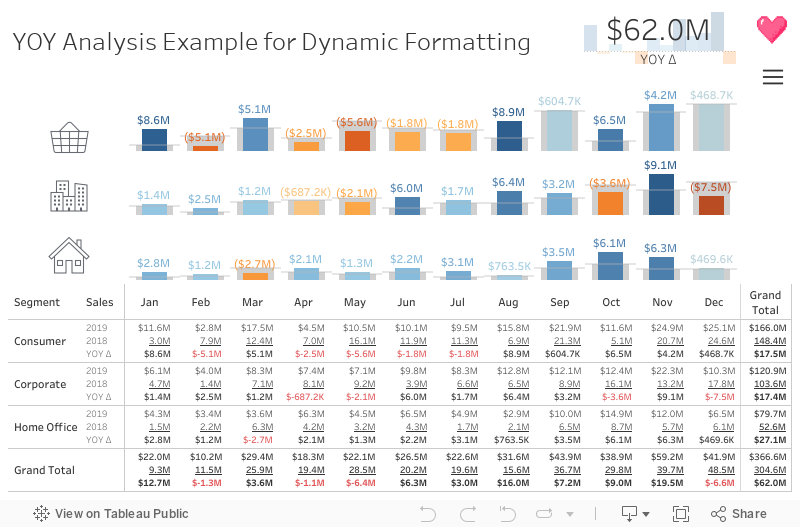
KPI labels are great, but what happens when we need to display multiple measures in a table?
Imagine a year-over-year analysis with three columns:
We want the values to display dynamically, with the appropriate units, without forcing readers to interpret long numbers.
For this scenario, we can create calculated fields that combine a rounded value with its unit.
Unlike our KPI approach, this method converts the formatted result into text.
Here's an example for Sales:
Calculated field: Sales Display
IF ISNULL(SUM([Sales])) THEN ""
ELSEIF ABS(SUM([Sales])) >= 1000000000 THEN STR(ROUND(SUM([Sales]) / 1000000000, 1)) + "B"
ELSEIF ABS(SUM([Sales])) >= 1000000 THEN STR(ROUND(SUM([Sales]) / 1000000, 1)) + "M"
ELSEIF ABS(SUM([Sales])) >= 1000 THEN STR(ROUND(SUM([Sales]) / 1000, 1)) + "K"
ELSE STR(ROUND(SUM([Sales]), 0)) END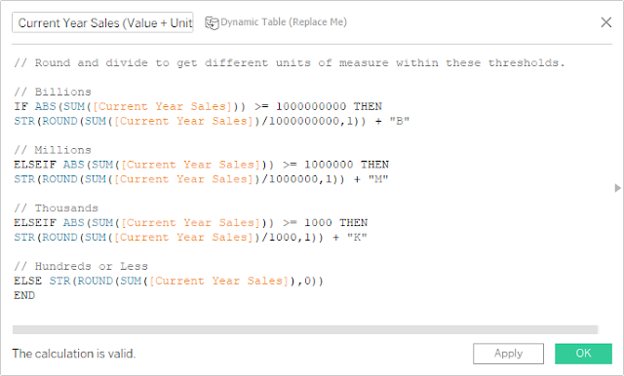
This gives us results such as:
Repeat this pattern for all of the measures you want to display.
Build the table
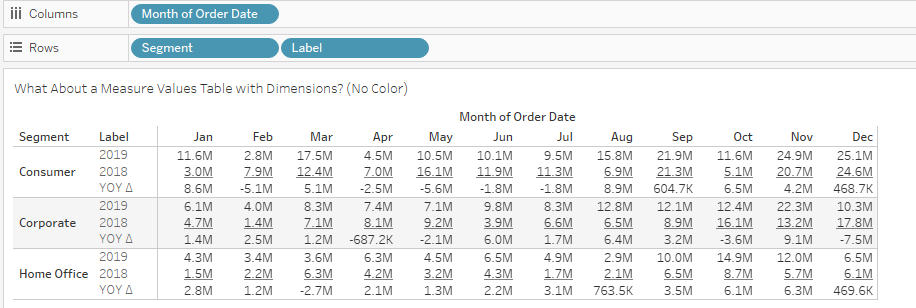
Place your formatted calculations in Text on the Marks card and arrange them in the desired order.
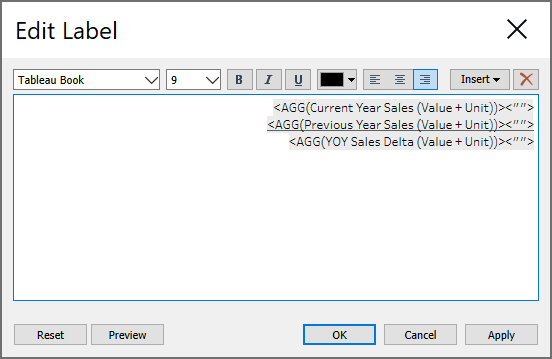
Because these calculations return strings, we can't use them exactly like regular numeric Measure Values.
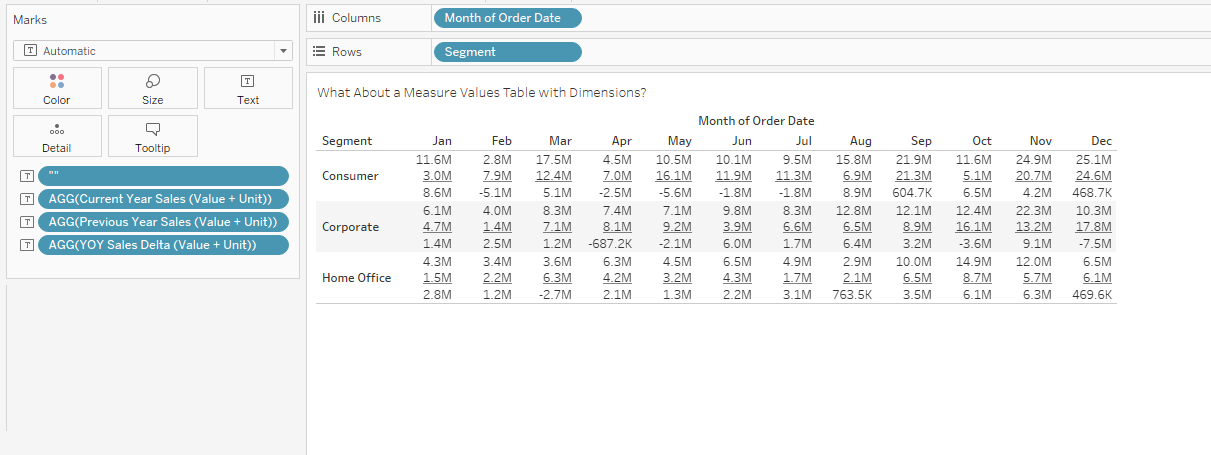
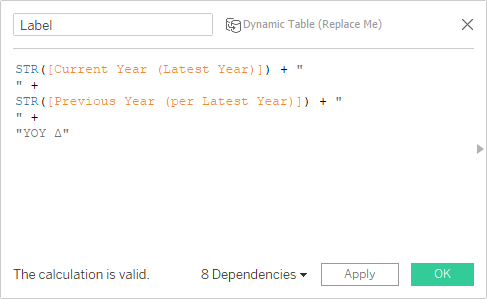
We can instead create a calculated field containing our measure labels, using line breaks to align the headings with the values.
For example, a label might contain:
Current Year
Previous Year
Change
Place the label field on Rows and adjust the text formatting until the labels and values align.
Tip: Null values can create awkward spacing. A simple calculated field containing " " can help maintain alignment when a value is missing.
The result is a compact table with readable numbers and clearly identified measures.
Now that our text table is working, let's make it a little more Tableau-y!
Color can help readers quickly distinguish positive and negative changes, especially when we're displaying year-over-year performance.
One way to achieve this is to split a formatted measure into two calculated fields.
Calculated field: Negative Values
IF SUM([Sales]) < 0 THEN [Sales Display] ENDCalculated field: Positive Values
IF SUM([Sales]) >= 0 THEN [Sales Display] ENDPlace both calculations on the same line in the Text label.
Then format the negative values in red and the positive values in a neutral color, such as black.
Only one calculation will return a value for a given mark, so the appropriate color appears automatically.
You can also use the space-padding technique from the previous section to maintain alignment.
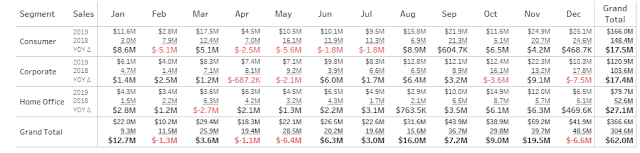
One important consideration: Red doesn't always mean bad, and positive doesn't always mean good. Choose colors that reflect what the measure actually represents.
For example, an increase in revenue may be positive, while an increase in expenses may not be.
Dynamic units make numbers easier to scan, but they also introduce rounding.
A displayed value of 1.2M might represent 1,180,000 or 1,240,000. Those differences can matter!
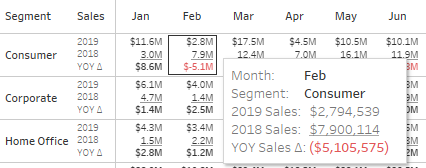
That's why I recommend including the original, unrounded measure in the tooltip.
For example:
Displayed value: $1.2M
Tooltip: Sales: $1,234,567.89
To do this, add the original measure to the worksheet's Tooltip and format it with the desired number of decimal places.
This gives readers the best of both worlds: concise labels for quick interpretation and precise values when they need more detail.
You can even add conditional color formatting to the tooltip if it helps communicate the meaning of the measure.
Dynamic units are a small formatting improvement that can make a big difference in how people experience a dashboard.
The key is choosing the right approach for the situation:
And remember to use ABS() when evaluating magnitude so your formatting works with negative numbers, too.
The goal isn't just to make numbers shorter. It's to make them easier to understand.
Happy vizzing! 💗



Have a question or just want to say hi?
I'd love to hear from you.